- I have a BSc, PGDipSci, and MSc (First Class Honours) in Statistics from The University of Auckland (the birthplace of R programming!).
- I have over nine years of programming experience and can program very confidently in R, Python, SQL, HTML/CSS, and LaTeX. I also have experience with JavaScript (especially in the context of R Shiny), MATLAB, SAS, and bash/shell scripting.
- My favourite areas of statistics are health and ecology, but I like to learn about anything!
- I have worked in a range of different roles:
- Information Analyst in the New Zealand health sector, creating R Shiny web tools and producing official government health statistics.
- Data Engineer at a digital marketing agency, using Google Cloud Platform.
- Analytics Engineer, developing R Shiny applications for pharmaceutical and cancer research purposes.
- Data Consultant for an AI company, collecting training data for LLMs and agentic AI assistants.
- Statistician/Research Analyst for a health economics and outcomes research company.
- The skills and tools I have used in my professional experience include: R (especially Shiny and the tidyverse),
Python (PySpark, NumPy, pandas), SQL, Excel, HTML, CSS, JavaScript, Databricks, Hex, Jupyter Notebooks, Google Cloud Platform (especially BigQuery), bash, GitHub, GitLab, Gitflow, CI/CD,
Agile development, and various statistical concepts (e.g. GLM/GLMM, ASR, time series).
- Right now, I'm learning Strudel REPL and Flask. At some point, this boring static site will become a nicer Flask site. I hope to eventually learn some JS libraries, Swift, AWS, and Power BI too! I love learning new tools and programming languages.
- I grew up in Aotearoa (New Zealand) and moved to Vancouver, BC, Canada in February 2023.
- Outside of work, I teach tap dancing, draw, play the drums, hike, camp, and I'm currently learning French. I love to read all kinds of books and I am a big Stephen King fan!
Check out some of my projects, publications, and presentations below
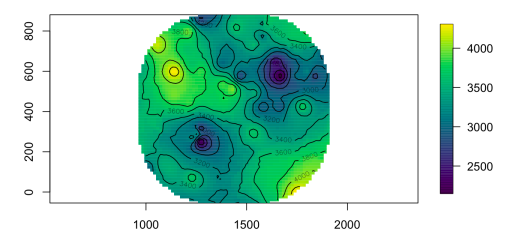
This was my dissertation project for my Master of Science in Statistics at the University of Auckland.
I created a simulation program to produce realistic acoustic capture-recapture data for the purpose of testing a new R package.
I received an A+ grade.
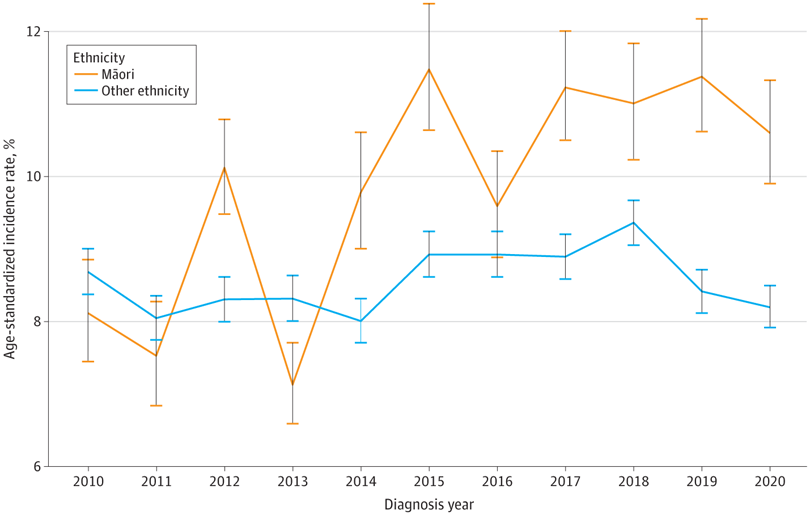
I co-authored this study to investigate differences in survival and mortality in patients with head and neck cancer in New Zealand.
My involvement included conducting survival analysis, calculating age standardized rates, determining sample size, and more.
Citation: Weaver A, Twine S, Bather M, Dowley A, Slough CM. Ethnic Disparities for Survival and Mortality in New Zealand Patients With Head and Neck Cancer. JAMA Netw Open.2024;7(6):e2413004. doi:10.1001/jamanetworkopen.2024.13004
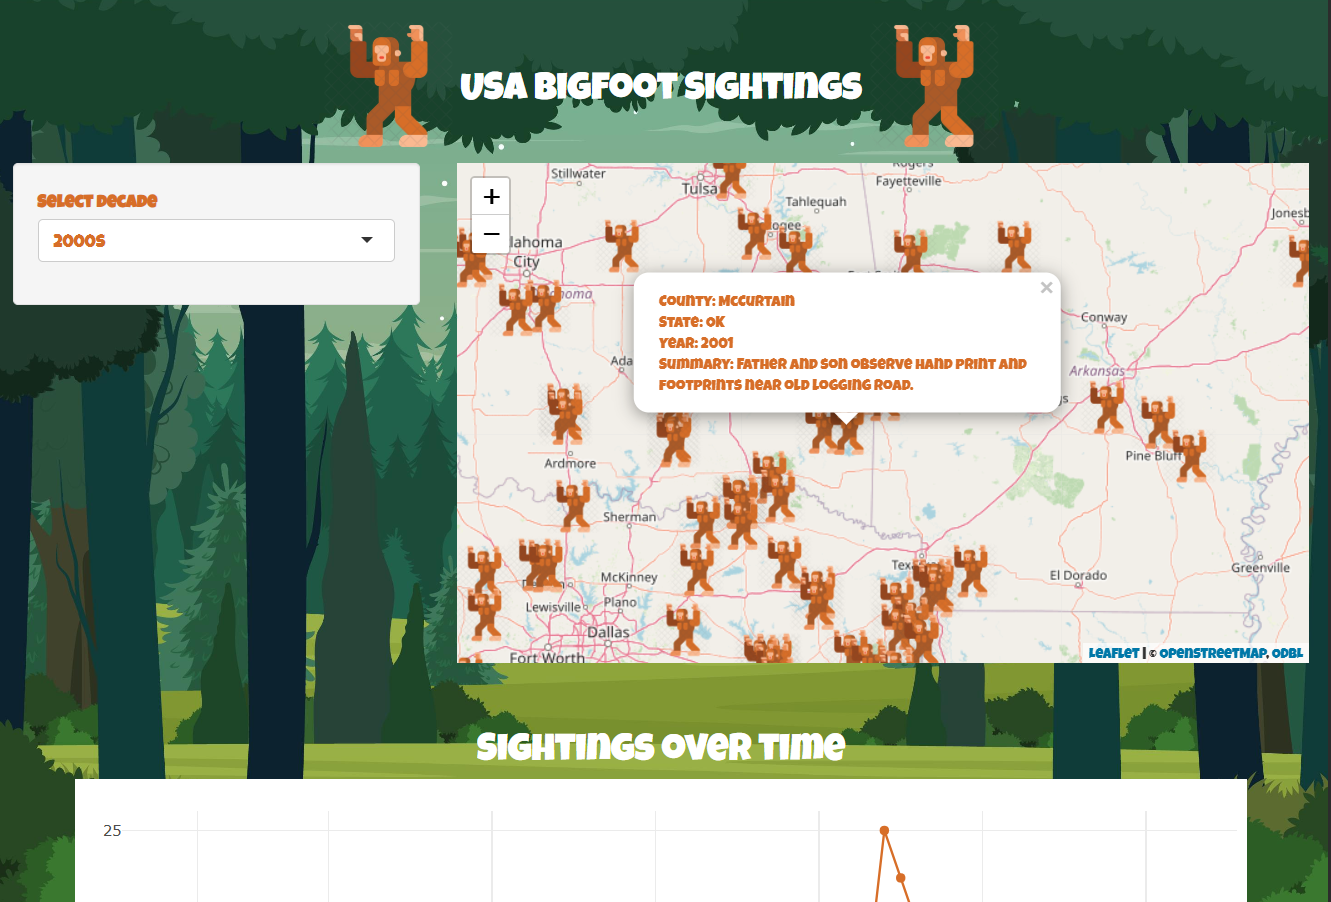
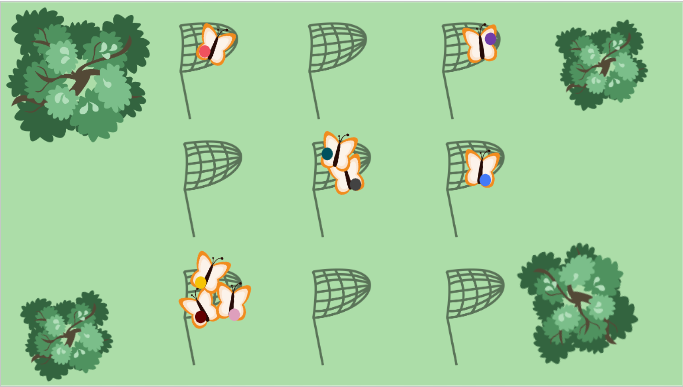
I ran a series of three workshops to teach a group of colleagues how to use R Shiny. During the workshops, we made a fun app to display bigfoot sightings on a Leaflet map and a Plotly graph. This was a simple app that brought us many laughs!
The data are scraped from North American Wood Ape Conservancy, which appears to be somewhat biased towards sightings in Texas.
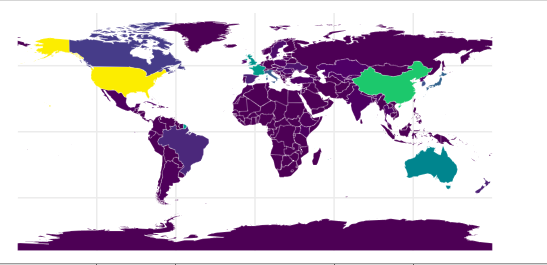
I created a simple R Shiny application to showcase medals data from the 2024 Olympics.
It uses a free API by codante, which updates every 5 minutes.
I gave this presentation at the Cascadia R Conference in 2023 in Seattle, Washington, about the basics of
spatially explicit capture-recapture (SECR), and how to use R for SECR modelling.
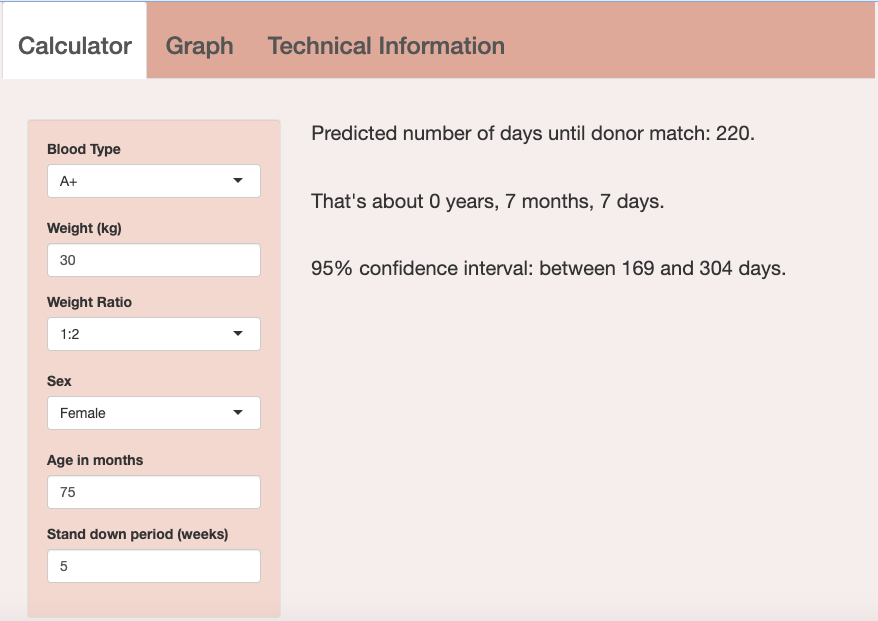
I created this R Shiny app for the Berlin Heart Study to estimate the wait time for a heart donor match
for pediatric patients in New Zealand.
The estimation algorithm, which I developed myself, uses the following techniques:
- Expected value of a geometric distribution
- Poisson regression
- Quantile regression with WHO childhood growth standards
- Clopper-Pearson confidence intervals
While this app isn't available publicly, a screen recording demonstration can be seen at the link below.
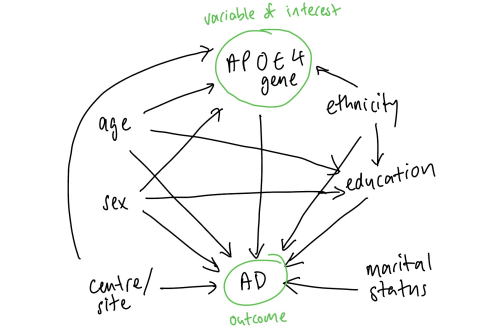
In 2022, I took STATS 770: Introduction to Medical Statistics as part of my MSc. The project I chose
for this course was to examine the relationship between the number of APOE4 gene alleles and the
presentation of Alzheimer's Disease and its various stages of cognitive decline.
I received 97% for this report, and an A+ for the course overall.
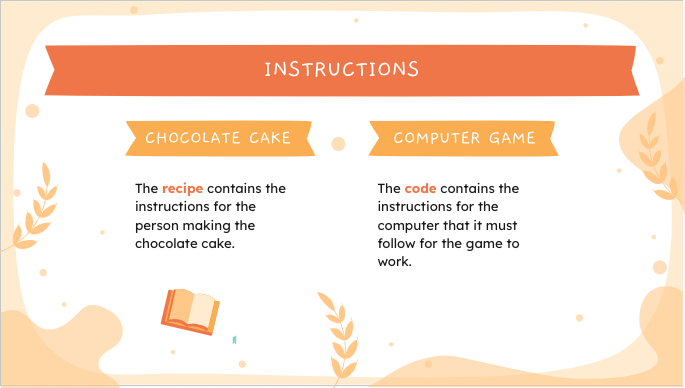
This presentation was given to primary school students at Bailey Road School for their Digital Media unit.
I am passionate about math education, and I have tutored high school math students since 2014, both privately and at two different businesses.
During this time, I have noticed some key topics that many students struggle with. One common difficulty
is finding the gradient of a line when the x- and y-axes aren't of a typical 1-1 scale.
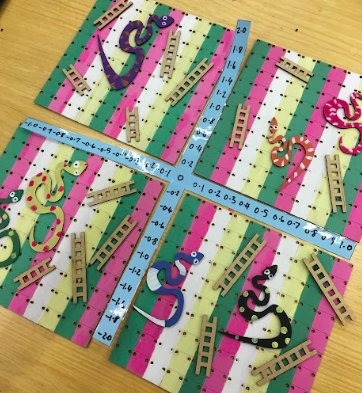
In 2019, for a university course about math education, I made a math version of Snakes & Ladders to help students with this issue.
The project received an A+ grade and is now used as an example of project work for students enrolled in the course.
I used a laser cutter and 3D printers, as at the time I worked as a Creative Technologist at a maker space.
In 2024, I have resurrected this project and have begun some improvements and refinements. I hope to eventually learn Swift so that I
can make it into a phone/tablet app.
Watch this space for updates!
I have been co-organising the Vancouver chapter of R-Ladies since 2023. We run multiple workshops throughout the year with the aim to encourage women and minorities to use R (but everyone is welcome to attend our events). Personally, I have run a web scraping workshop and co-taught a beginner R workshop series.